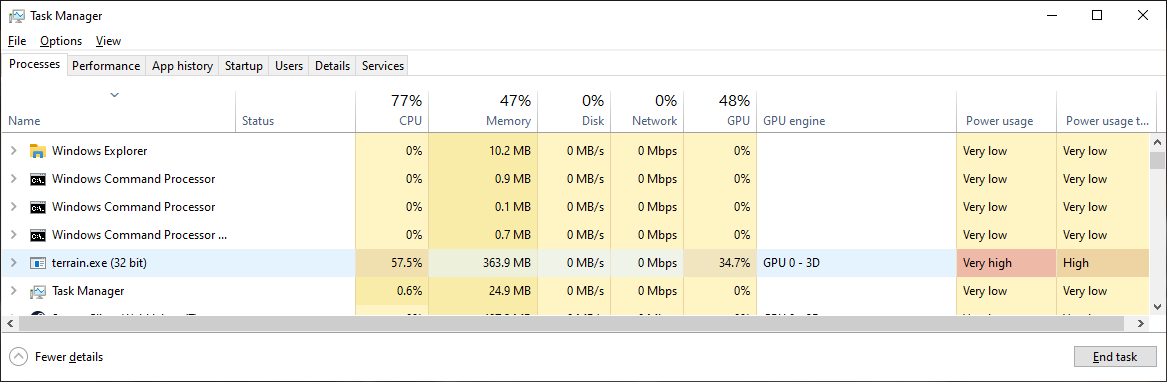
I have somehow gained a memory leak over the past month. It eats about 200k per second continually until heap overflow (32bit version, in 64bit it eats about 4x that).
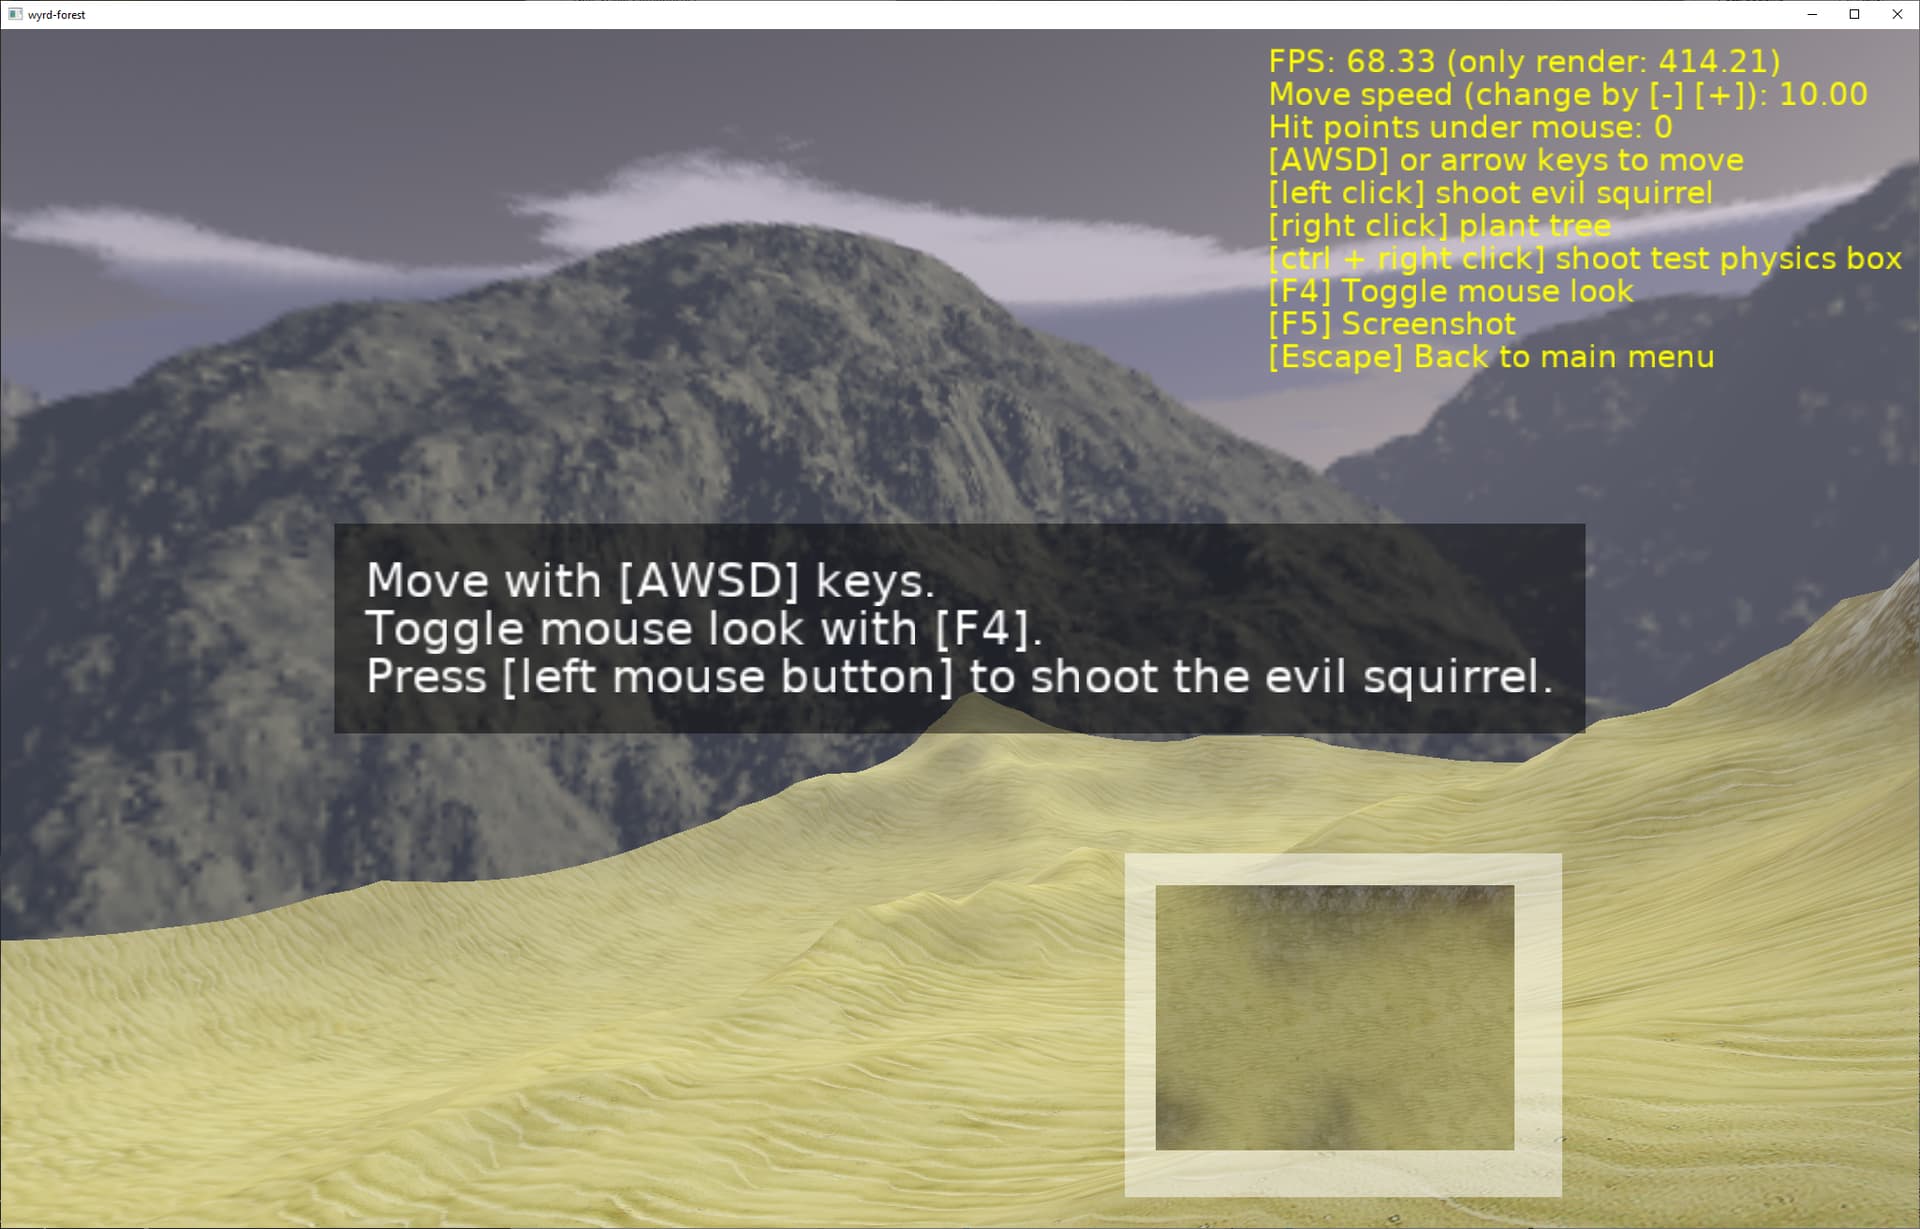
Vanilla wyrdforest doesn’t leak. If I comment out my whole main Update, and comment out anywhere I build anything, so we are just left with the vanilla terrain and a few static resources around the screen that come from the manifest xml … and then do nothing so mouse is never over program… it still eats the memory. At that point all my code is fully disengaged and shouldn’t be getting hit. When it does heap overflow, the location it crashes doesn’t seem to be related to the leak.
I am not sure how to go about figuring out where the memory is going and what the culprit is. Using Lazarus, freepascal.
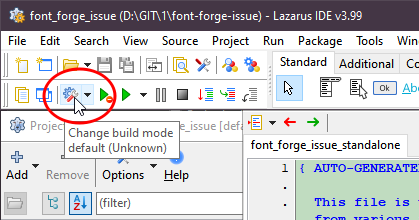
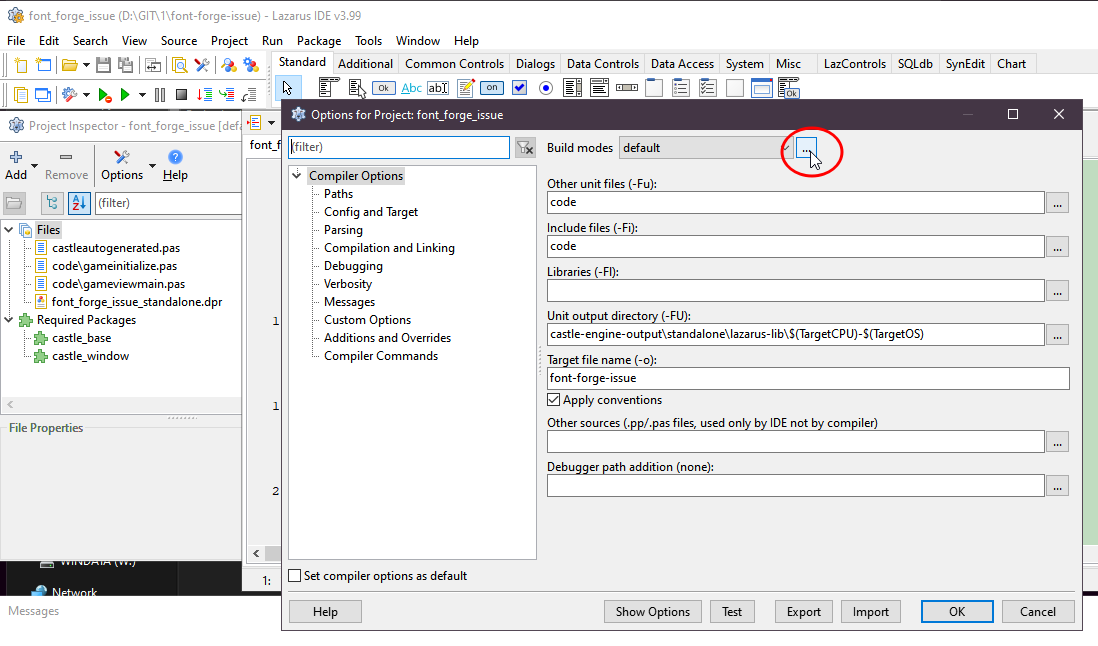
Memory leaks are complicated things and finding the reasons may be rather tricky in a large existing project. So it’s a good idea to learn how to deal with those and “hunt” them regularly.
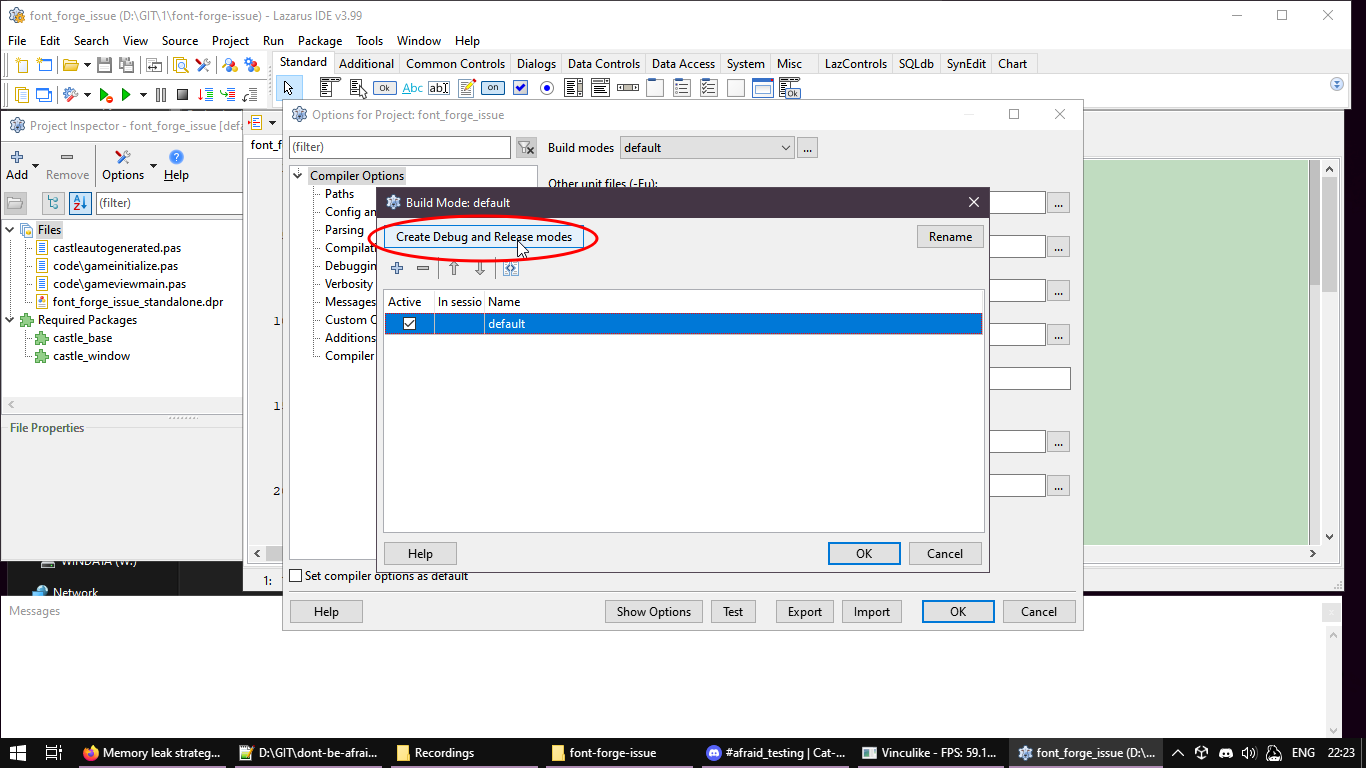
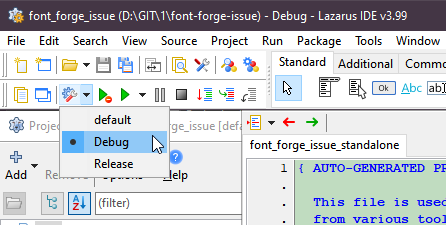
Confirm and save the changes, now your project will run in Debug mode. You can change the mode in which project runs (Debug - slower but more information including report on memory leaks; Release - faster execution, but less information) in the same place:
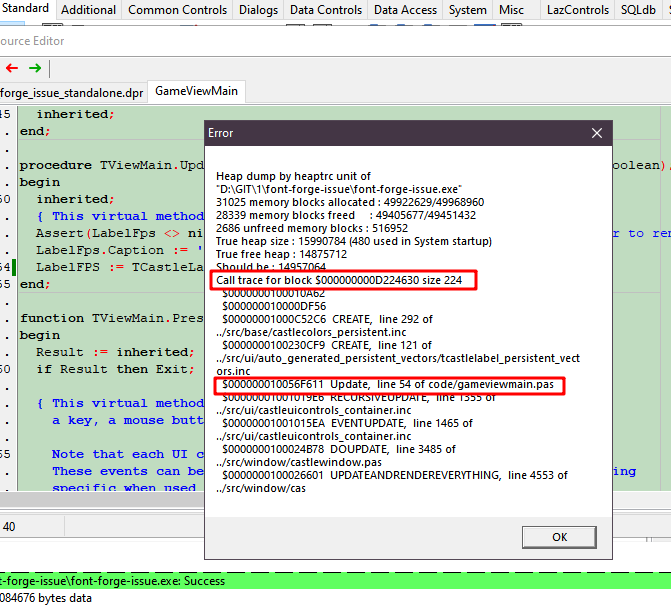
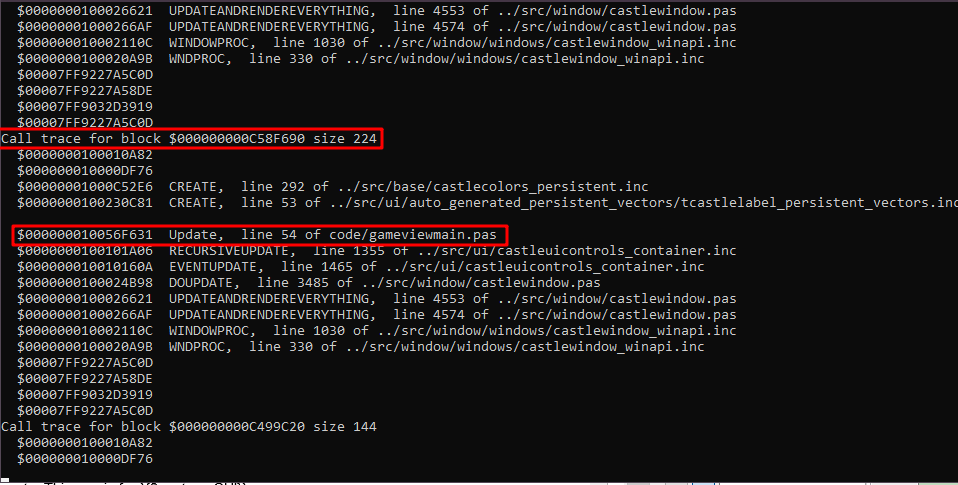
Now, depending on some OS specifics and Lazarus version you’ll get different kinds of memory leak reports. This one is for {$apptype GUI}:
Note the lines of the report I’ve highlighted in red. Those are the actual reasons for the memory leak. Specifically in this example I’m creating a TCastleLabel.Create(nil) in Update, therefore creating multiple labels and making a memory leak block every frame.
The “indicator” is that this line of code points to our own code, in contrast to ones pointing into Castle Engine code - which while hypothetically can contain bugs and leaks, but unlikely to and if the leak traces outside of your code it will need more (and more complex) investigation.
So, as soon as you have the line of code that triggers the memory leak, you can investigate it and hopefully resolve the issue. Sometimes it is very counterintuitive, but happens trivial.
There are a few other potential issues that can be very hard to resolve, or some memory leaks that you will not receive memory report on. But let’s first try the above.
Thanks for the tips. Somehow I thought I was already in debug mode, this will be helpful. Unfortunely the blocks of memory it flags at the end are not the memory that is being eaten. That memory appears to cleanup at end of program.
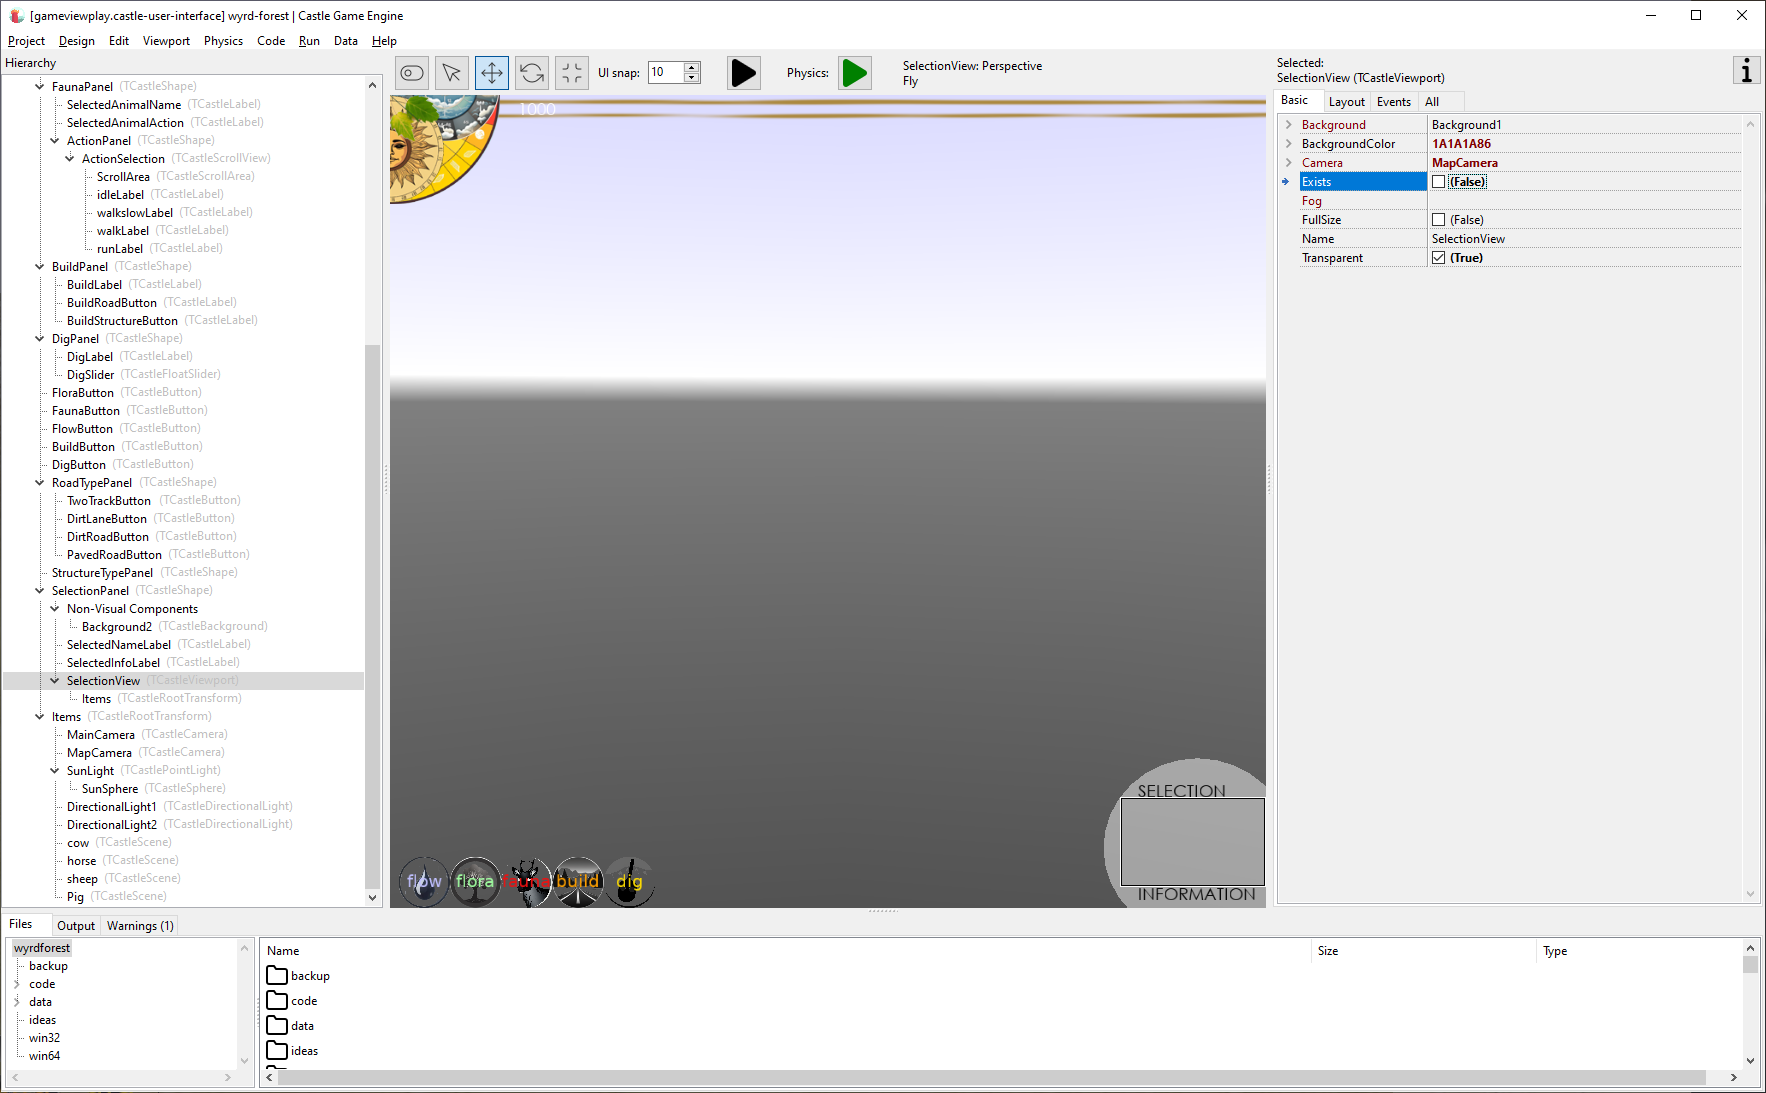
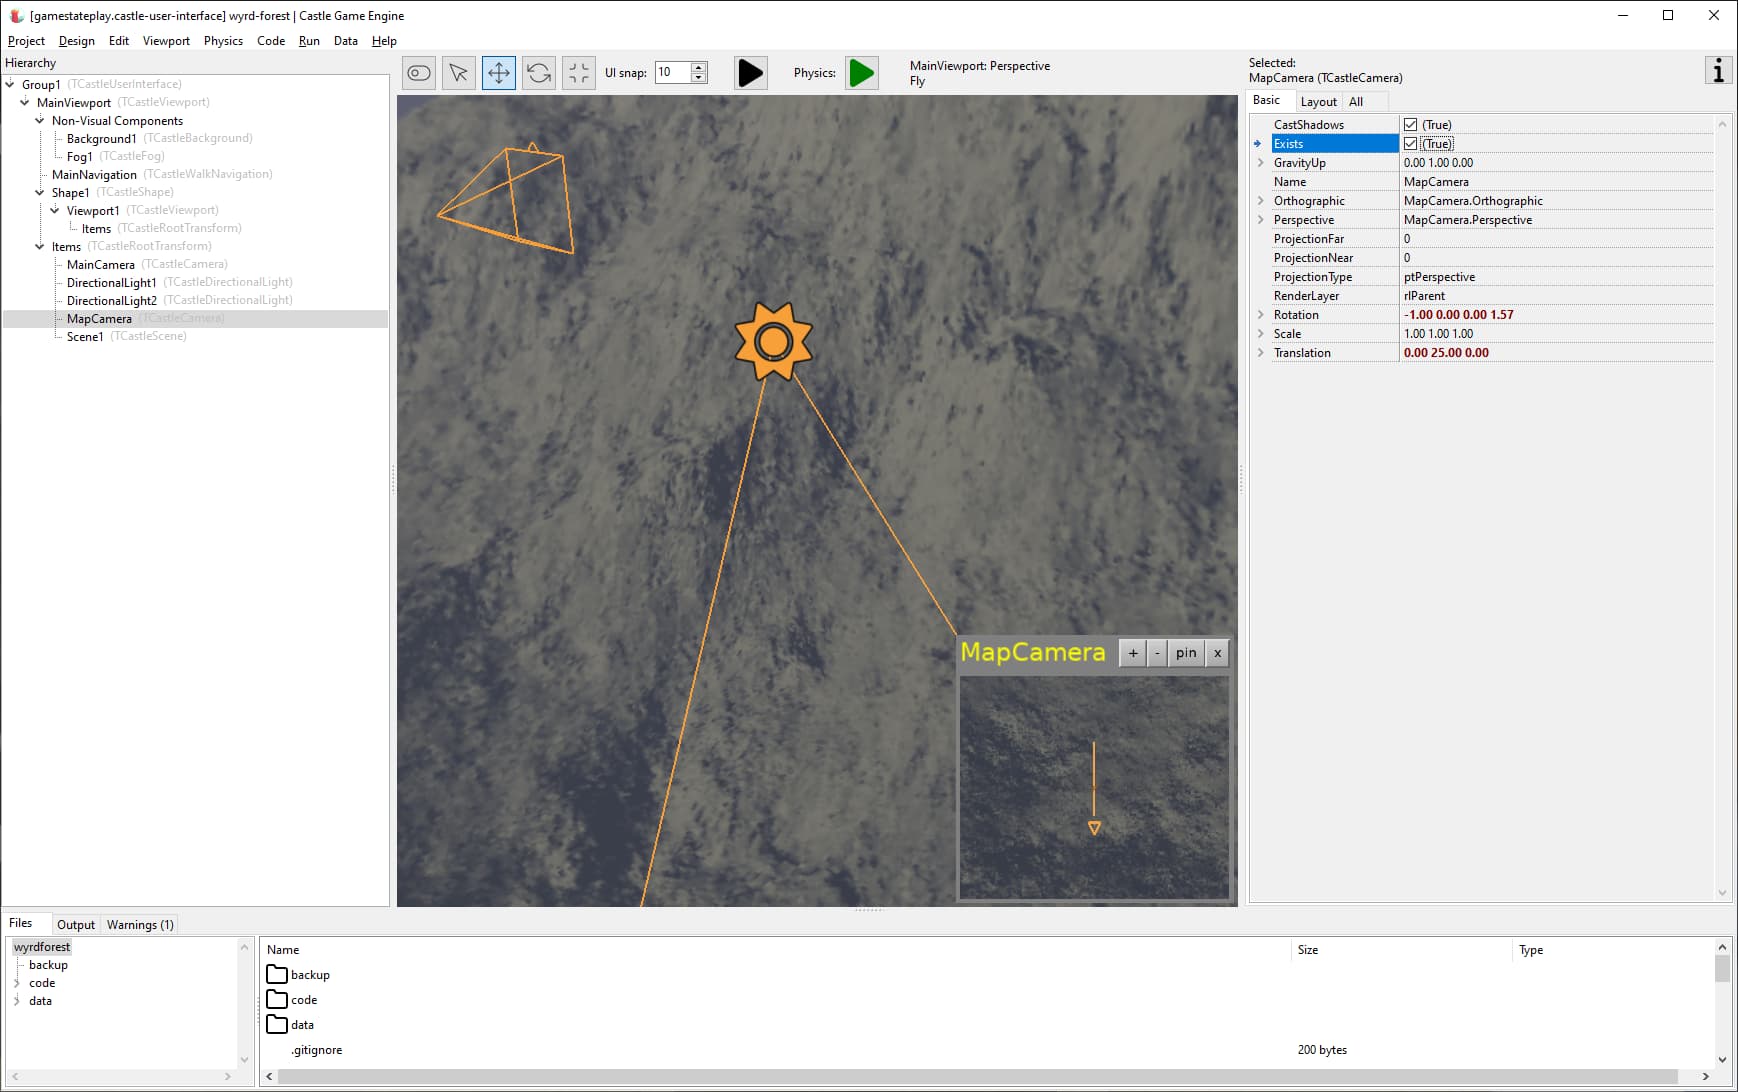
I thought to when the problem started and on a hunch, I set exists=false on my minimap viewport. The leak goes away. That SelectionView is a transparent TCastleViewport that holds a MapCamera positioned high above the whole scene.
I don’t have any code for this, it is all done in the castle editor. If that viewport exist=true, it eats about 200k per second.
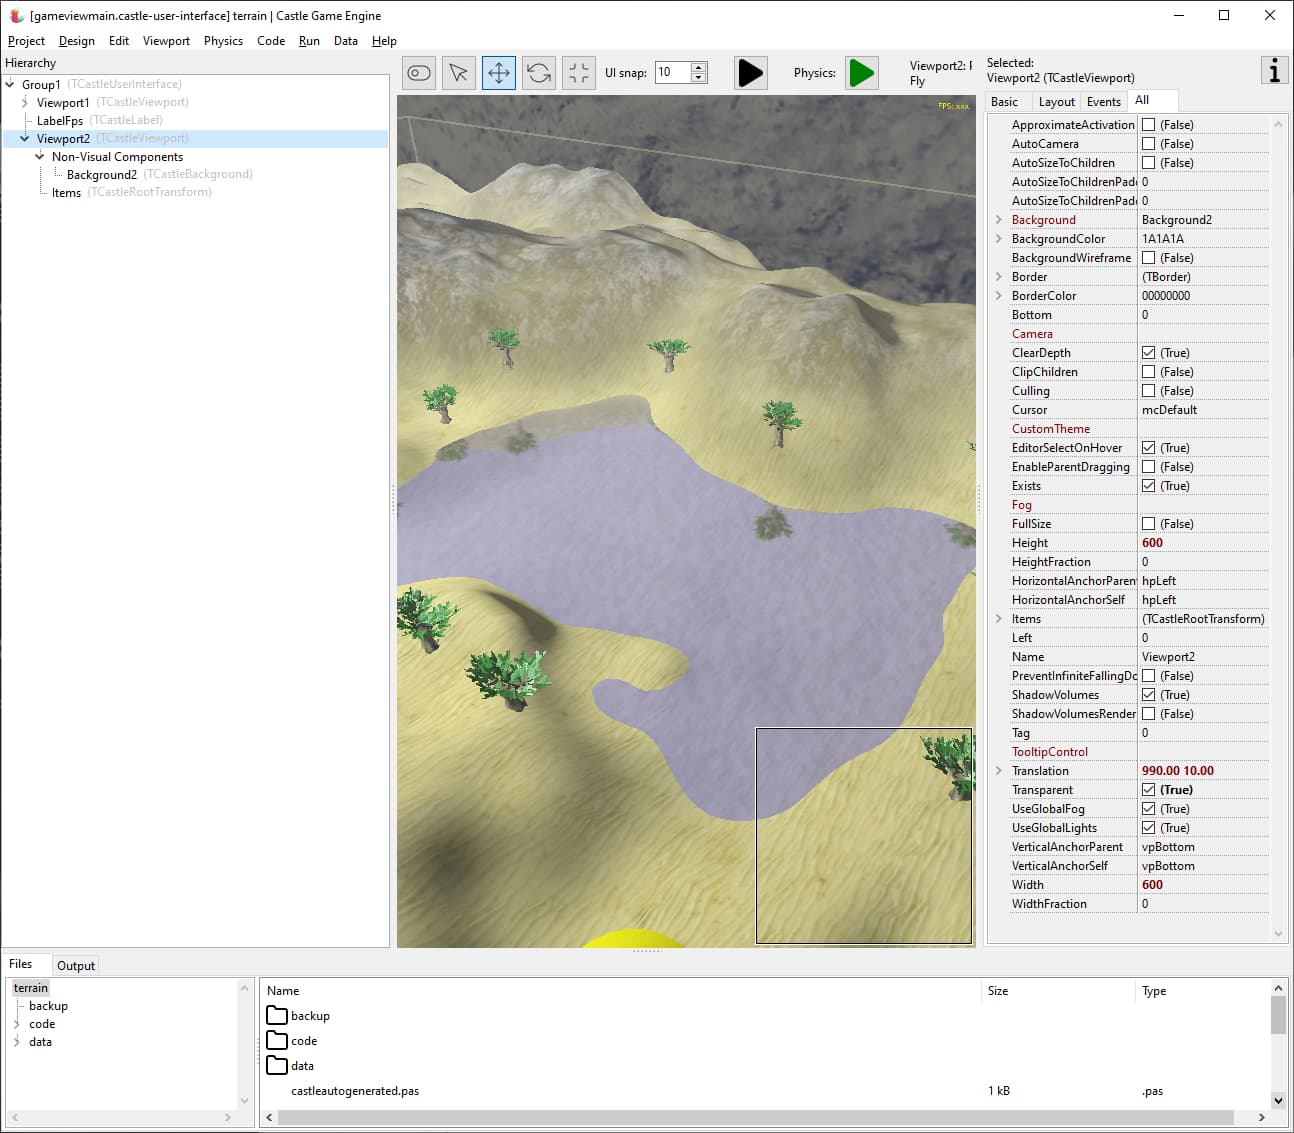
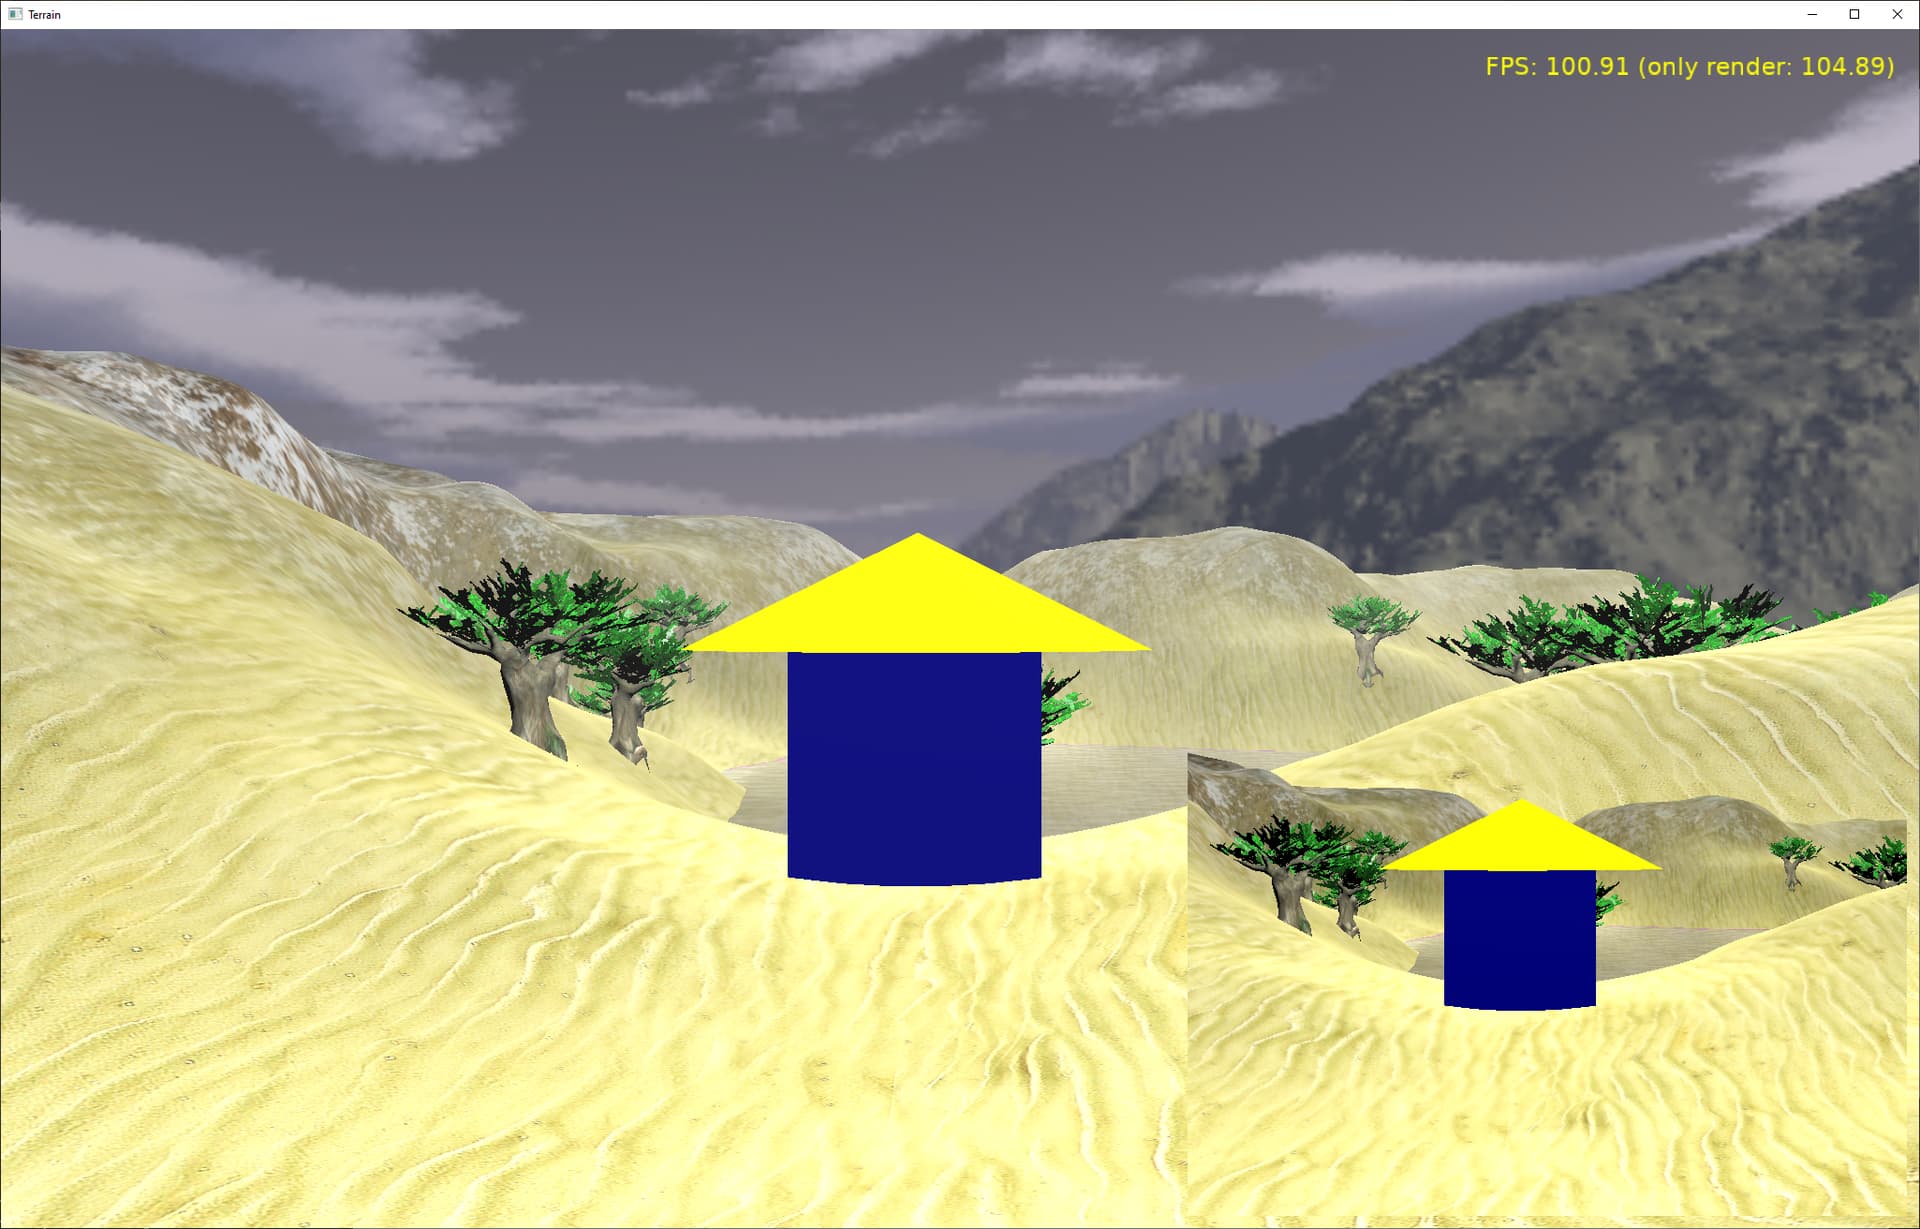
Narrowing down the issue, if I turn on the minimap viewport, but set Transparent to false, it also doesn’t eat memory.
It seems the issue is specific to transparent viewports.
Can you send a bugreport with a testcase to Issues · castle-engine/castle-engine · GitHub ? I.e. a full example with code + design, that I can open and investigate? If the code is trivial, and the problem is already there after setting up components in the editor → even better, i.e. the issue will be more obvious to debug.
If we leak some memory on the engine side, we definitely want to fix it
Also if we allocate something new and it accumulates each frame, then it’s also something we want to fix. (Even if it gets freed when viewport is destroyed, so strictly speaking is not a “memory leak”, but it still makes memory grow each frame → this is naturally something that shouldn’t happen and we want to fix it.).
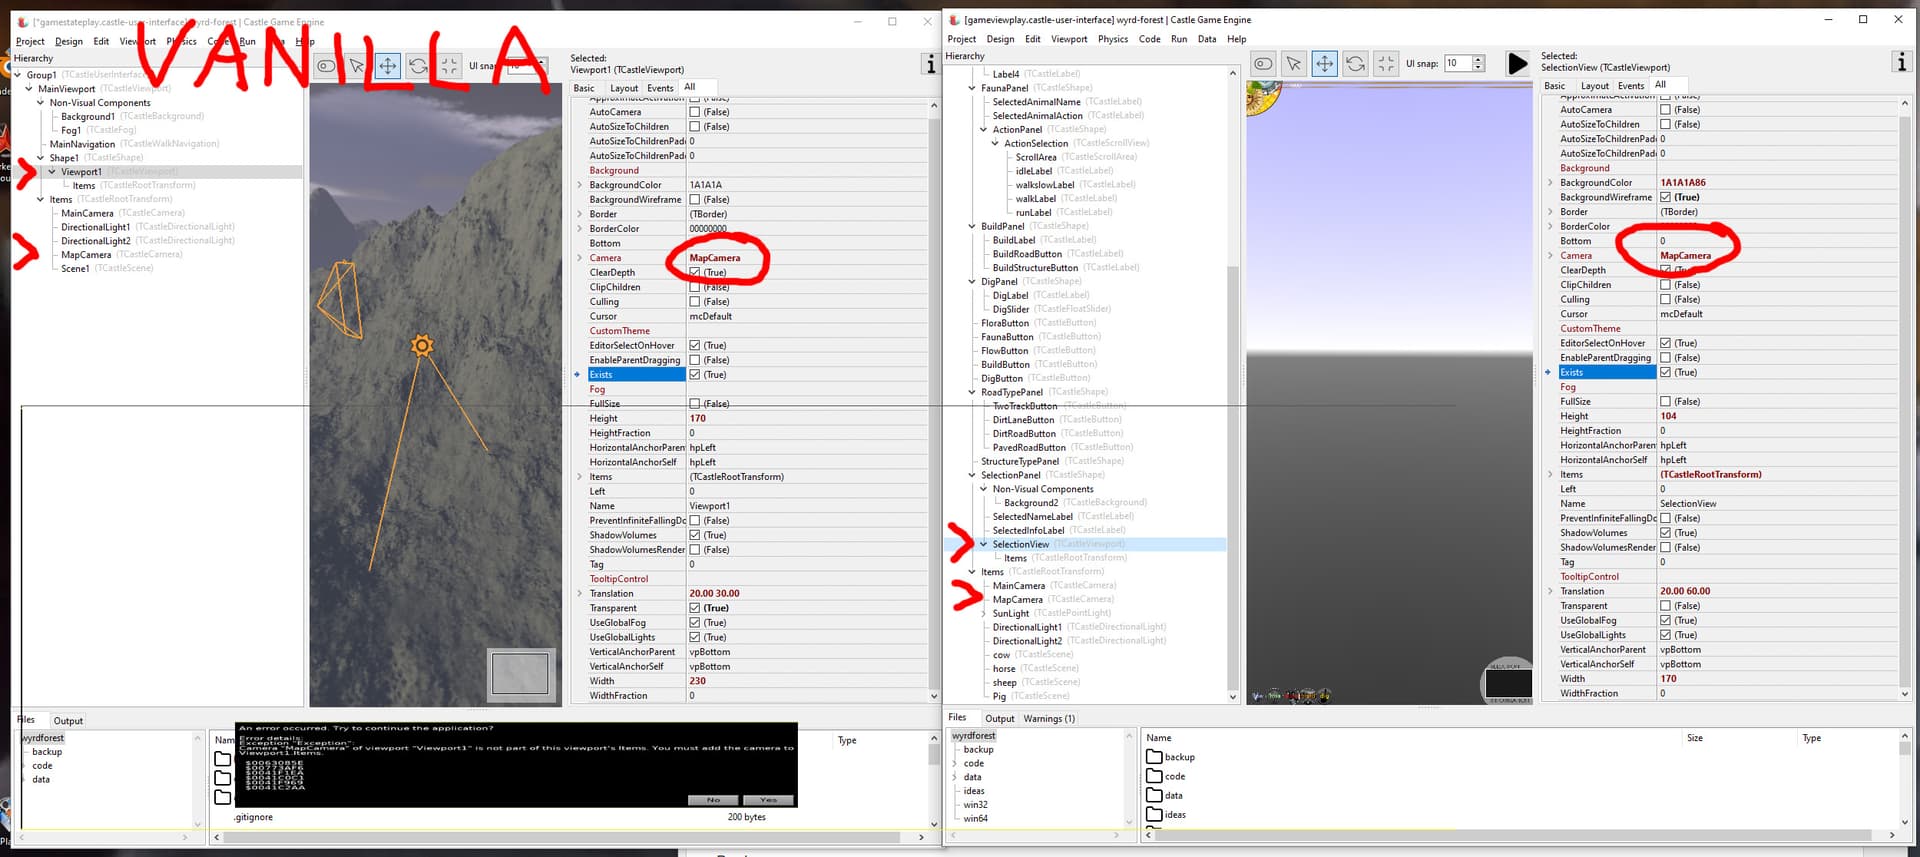
Hmm, I thought it would be easy to simply modify the manifest of the vanilla wyrdforest to reproduce the memory issue. I created a transparent shape off of the MainViewport and put a TCastleViewport in it. I created a TCastleCamera called MapCamera off the MainViewport.Items. I position the camera high up, looking down. so I will see the terrain. In my spinoff of wyrdforest, this works. But in wyrdforest vanilla, when I run it throws exception ‘Camera “MapCamera” of viewport “Viewport1” is not of this viewport’s Items. You must add the camera to Viewport1.Items.’ My SelectionView1.Items is empty and the camera is in the MainViewport Items and it doesn’t complain. Why is it different??
Hm, I’d need to see a testcase (code and design, complete project) to understand it better and tell what’s wrong. In general we indeed require that camera, set as MyViewport.Camera (whether using editor or code) is part of this viewport’s items, i.e. MyViewport.Items (it may be of course an indirect child, underneath some TCastleTransform(s)).
Hope this helps. I’m not sure how can it be related to memory leaks – but to tell for sure I’d again need to see a complete testcase to debug Note that if memory leak occurs already in the design (no code needed) than CGE editor itself may also leak memory.
Hmmmm… for me there is absolutely no memory increase when I run the project from Lazarus. The Wyrd Forest stays at same 296.5 Mb of RAM usage for arbitrarily long (varies only between launches, closely around this number).
When ran from Castle Editor, indeed, the project size increases with time - however, it not only increases, but also decreases sometimes. Also the increase only happens when I actively interact with stuff (shoot targets or spawn trees). Which is technically relatively expected. Still after several minutes of standby and actively running around I ended up with 200 Mb of Ram, less than Lazarus build.
Then we need a project that will definitely have the issue. This are the two modified files that I’ve changed in wyrd-forest to add the overhead camera: wyrd-forest.zip (5.3 KB)
But ideally it should be something smaller than a “big game”, even a standard one. I can try to come up with some small overhead camera example - but as I don’t experience any memory leaks - maybe it’s something specific on your side? Can you try pasting the two files from the archive above and see if you have the memory stably increased?
Sorry, I’ve had an intense week and wasn’t following the topic closely. Sorry if I’ve missed some details. I see the screenshots above are from Windows, right? Which version - 10 or 11? Or some other? 32 or 64 bits?
I am on windows 10. This happens in both 32 or 64 bit, but in 64bit it eats memory faster. Your files are not compatible with my wyrdforest, maybe mine is old. Not sure the difference between gamestateplay and gameviewplay. The changes are simple though so you should be on same footing. I had thought the mini viewport had to be transparent to leak, but that isn’t the case. Leaks either way. Leak stops when I set that viewport exists=false.
I cannot reproduce the memory leak at Windows 10x64 bit. The game slightly fluctuates the memory, but if release build or ran from EXE - it stays around 128 MB for arbitrary amount of time even when moving around the map. Slightly more than that if ran from Lazarus (i.e. with a debugger) but also stays on a single number.
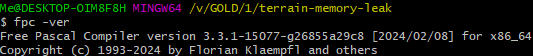
Can it be some 32-bit specific issue? But I guess let’s first figure out if something in configuration can cause issues. What is the FPC version you are using? I’m using (almost) the latest stable FPC trunk:
now I’m not so sure if -ver actually shows the version, or just crashes and showing of the version is a part of a every compilation (because I’m using Lazarus most of the time and don’t compile in bare FPC). But anyway it shows you the version
I am running from Lazarus in debug mode. I am not doing anything in the terrain demo, just leave it where it starts. I get the same behavior with 64 bit, but it seems to go faster. Lazarus says my fpc is 3.2.2. I will update.
Hmm, 3.2.2 seems like the latest release at freepascal.org and lazarus sourceforge page. Is there somewhere you can download a 3.3.1 installer and not have to build it?
@michalis Are you able to run this built from 3.2.2 under windows and experience the leak? Since 3.2.2 is the latest release of fpc, it seems like any issues leaking on 3.2.2 need to be addressed? This is becoming a roadblock for me as I am unable to turn on my minimap for more than a half hour before I run out of memory.
Not exactly. 3.3.1 is an unstable version of FPC. It’s also called Trunk (even though FPC already switched to GIT from SVN long ago). It’s a version that is not recommended for regular users, however, it contains an important bugfix that crashes my game, so I’m using Trunk instead of a stable build. But in general 3.3.1 is more likely to be “unstable” than a stable FPC version. Especially in terms of memory leaks.
However, it might happen that there was a bug in 3.2.2 that could have resulted in hidden memory leaks in this specific situation and it was fixed in 3.3.1.
You can try installing version 3.3.1 using FPCUpDeluxe: fpcupdeluxe | Manual | Castle Game Engine
However, I’d say not to rush. Let’s first make tests and find the steps to reproduce the problem - often it’s >50% of the problem’s solution
We want to work and fix all issues (including memory leaks) in all supported FPC versions, see Supported compilers and IDEs | Manual | Castle Game Engine . This always includes latest stable, FPC 3.2.2 now, right now it also includes older 3.2.0, and it also includes newer 3.3.1.
But it likely will make no difference. It is possible but unlikely in my experience if the FPC version matters here. If there’s a leak, it is likely from something CGE is doing, and probably independent of FPC version.
As for me reproducing:
Hm, I cannot reproduce the problem.
I tested on Windows 11, 64-bit, with FPC 3.2.2, build from Lazarus, doing debug build of the project attached in Memory leak strategies? - #14 by edj .
It’s weird, but after some time Windows Defender reported the file as suspicious, said it detects the Trojan:Script/Phonzy.B!ml inside. Haven’t seen it with other CGE examples, not sure what activates it. Anyhow, that’s probably unrelated. I said to “enable” this file and it all works. (In a production environment, I guess signing the EXE would be a good idea to help Windows to consider it valid.)
Right after run it uses 137 MB, drops to 127 MB in a few seconds. Then stays at this for a loong time. I’m not doing anything (leave it running the background), or I’m moving with AWSD – doesn’t seem to make any change to memory immediately.
After 20 minutes it uses 129 MB (but it doesn’t mean it will keep growing at 2 MB / 20 minutes, just that some allocations happened and at some point, we have 2 more MB from OS).
I’ll leave the process running and report if it seems to grow indefinitely.
Ideas:
Can you send your EXE file here? I can run it in some virtual machine and observe. This will tell us with 100% confidence if the issue is in any way specific to your build environment (FPC version, maybe some virus – though again unlikely) or run-time.
Can you test your EXE on different systems, with different GPU? It seems unlikely but maybe your OpenGL makes some memory leak?
Build from CGE editor, let the CGE build tool copy the proper DLL files to your project. Check if running the EXE with these DLLs changes anything.