Fast profile? or higher resolution than gettickcount?

I read your docs on profiling. It seems like the tools are really slow. I have often just used GetTickCount to measure chunkier performance where things take hundreds of milliseconds. Is there anything that beats its 16ms resolution?

I am trying to figure out a strange performance anomaly in my behavior tree processing. It updates every animal in its list every frame. using gettickcount it takes 0 or 16ms to process 20 animals. And each individual animal is 0. Nice and fast even with debug mode and heavy console output. The animals do stuff, wandering around, swimming and drinking for about 10 minutes and then suddenly my framerate crashes. I see that every other frame processing all the animals is taking 200ms and then the next 0-16, then 200… over and over. Yet each of the 20 animals is still taking 0ms by themselves. It is just looping a list of animals calling update on each, there is nothing that would account for the rest of the time. I know this is nothing engine related but so weird. If the profiler tools really are so slow, it may take a long time before this issue emerges as hundreds of thousands of frames go by before it starts. I think it might be easier to see if I had more accurate timing than gettickcount provides. Does anyone know of such a thing that works in pascal?
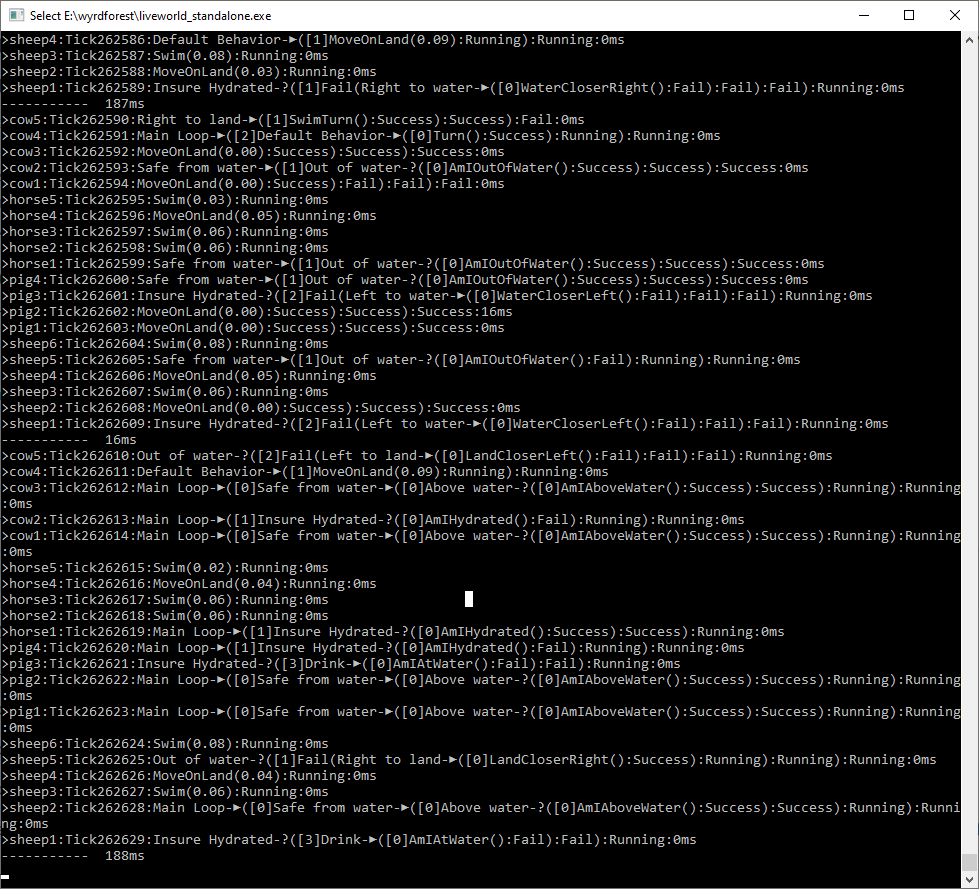
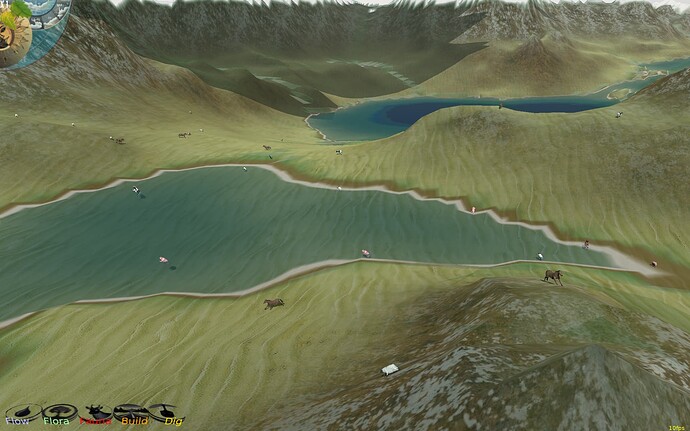
I found what it must be… Some of the animals are missing some of the animations. When it is running chunky there are warnings like (Warning: Animation "Run" not found on scene (loaded from ) mixed in.

They all have all the animations. The problem is my LOD system unloads the model in its scene and replaces it with some faces. But then it tries to set the animation that went with the animal model and that seems to cause the slowdown. I have to protect against this. So it took a while to happen because they have to wander far enough to get unloaded.

Specify which profiling tools do you use – as they should not be slow :slight_smile:

That is, the most basic tool is just Timer call (from CastleTimeUtils). Can be used like this:

var
  TimeStart: TTimerResult;
  Seconds: TFloatTime;
begin
  TimeStart := Timer;
  // ...  do something time-consuming ...
  Seconds := TimeStart.ElapsedTime;
  WritelnLog('Seconds passed: %f', [Seconds]);
end;

This is not slow – under the hood, Timer features a few cross-platform implementation that strive to be both precise and fast.

On Windows, it means using QueryPerformanceFrequency + QueryPerformanceCounter with API provided for Windows exactly for such purposes, from what I know, and it should be both fast and precise. If QueryPerformanceFrequency + QueryPerformanceCounter are not available, we fallback on CastleGetTickCount64 , which is usually using Windows GetTickCount64. It’s all in CastleTimeUtils unit (which is split into a few include files), see castle-engine/src/base/castletimeutils_timer.inc at master · castle-engine/castle-engine · GitHub .

More hierarchical profiling in CGE is to use Profiler , Castle Game Engine: CastleTimeUtils: Class TCastleProfiler . Which is using just Timer under the hood to measure all times. It can be used just like this

var
  TimeStart: TCastleProfilerTime;
begin
  TimeStart := Profiler.Start('Loading something (TMyClass)');
  try
    // do the time-consuming loading now...
  finally
    Profiler.Stop(TimeStart);
  end;
end;

and in the end, display the Summary (see Castle Game Engine: CastleTimeUtils: Class TCastleProfiler docs). This is an improvement over Timer, as it can analyze (at the Summary moment) a hierarchy of calls.

There are other ways to profile that we support, like Valgrind (super-powerful, but also admittedly slower, due to Valgrind instrumentation – but the resulting conclusions are unaffected in this case, i.e. it points you what to optimize very nicely).

OMG I found my problem. A bug using y instead of z when calculating distance from camera to the animal for lod. This would cause it to unload and reload the animal over over… one frame unload, next frame load… but only then when camera at certain heights. I will try your profiler next time. So it does have higher resolution than 16ms?

I’m honestly not sure about this – experiments to check it, confirm, deny, → are welcome :slight_smile:

I know that we use QueryPerformanceFrequency + QueryPerformanceCounter which seems to be what WinAPI recommends to exactly this. See QueryPerformanceFrequency function - Win32 apps | Microsoft Learn . But I’ve never done experiments what is the “real” frequency (since naturally it can be worse than what QueryPerformanceFrequency returns).

It looks like TTimerResult is good for at least 0.1 ms which is much better.